資料搜尋諮詢服務
找不到您所需要的資料嗎?
我們能協助您找到最符合您研究需求的資訊
請撥打 +886-2-2799-3110
或透過電子郵件與我們聯絡 mi@hintoninfo.com
IHS_EWBIEEE xploreSTRATEGY ANALYTICSIHS_EWB_GF

頁面路徑選單

System-on-Chip Market by Type (Digital, Analog, and Mixed Signal) and Application (Consumer Electronics, Telecommunication, and Automotive) - Global Opportunity Analysis and Industry Forecast, 2017-2023

  • LinkedIn
  • facebook
  • Twitter
出版日期:2018/02/01
頁  數:195頁
文件格式:PDF
價  格:
USD 5,370 (Single-User License)
USD 6,450 (Multi-User License)
USD 8,995 (Global-User License)
線上訂購或諮詢
 

System-on-Chip Market Overview:

System-on-Chip (SoC) is avn integrated circuit (IC) that consists of various components such as control unit, memory blocks, timing units, and interfaces mounted on one single chip. SoC is similar to the central processing unit (CPU) of the computer. For instance, it is compact in nature and occupies lesser space when compared with the CPU. The components of the SoC may vary depending on the intended use of it onto the device.

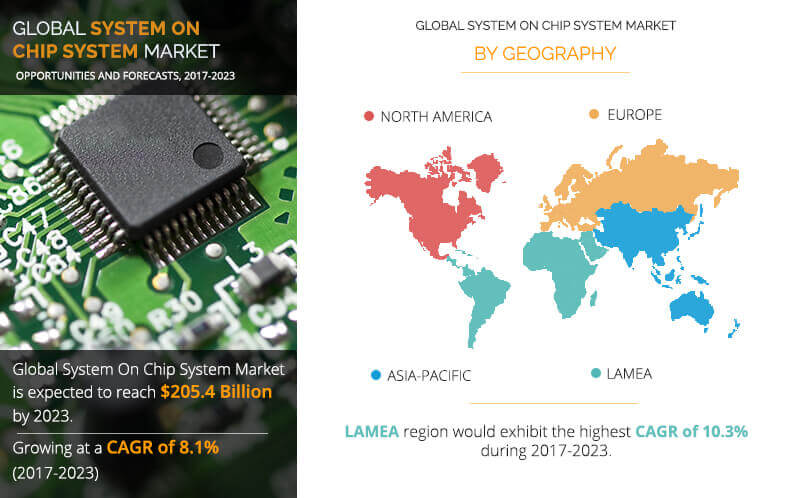
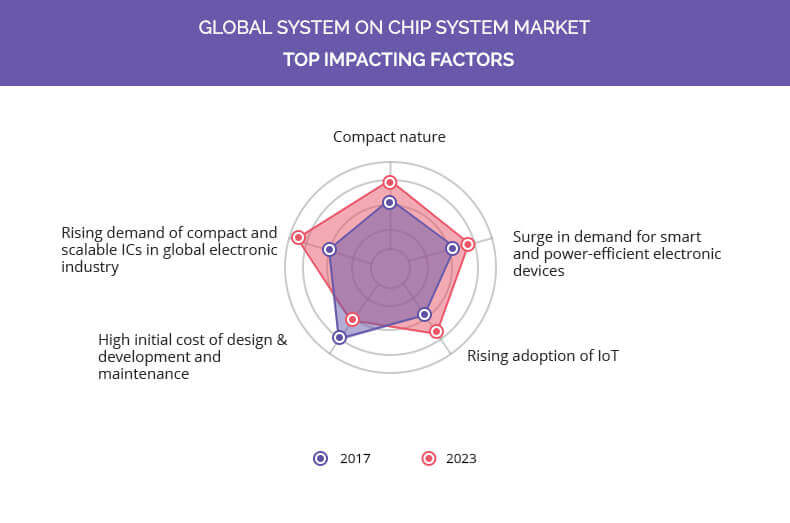
Factors such as compact nature of SoC, surge in demand for smart and power-efficient electronic devices, and rise in adoption of IoT supplement the global system-on-chip market. However, high initial cost of design & development and maintenance hampers this stated growth. Furthermore, continuous increase in requirement of compact and scalable ICs in the global electronic industry is expected to present numerous opportunities for market expansion.

The major companies profiled in the report include Intel Corporation, Samsung Electronics Co. Ltd., Qualcomm Incorporated, Toshiba Corporation, NXP Semiconductors N.V., Broadcom Limited, STMicroelectronics N.V., Apple Inc., MediaTek Inc., and Taiwan Semiconductor Manufacturing Company Limited.

Segment Overview

The system-on-chip market is segmented based on type, application, and region. The types covered in this report include digital, analog, and mixed signal. Based on application, the market is divided into consumer electronics, telecommunication, and automotive. The regions analyzed in this report are North America, Europe, Asia-Pacific, and LAMEA.

Get more information on this report : Request Sample Pages


Get more information on this report : Request Sample Pages

Compact Nature of SoC

SoC consists of various different microprocessor subsystems along with I/O interfaces and memories. All these components are mounted on the same chip and are connected internally, which reduces the overall size. Moreover, the SoC provides higher design security at firmware and hardware levels. The design of upgraded SoCs in smaller size is underway, which offer doubled computing speed when compared with its predecessors. This in turn drives the system-on-chip (SoC) market.

Increase in Adoption of IoT

The market is witnessing rapid adoption of Internet of Things (IoT), due to high penetration of Wi-Fi connectivity, increase in demand for smart wearables, technological enhancements in wireless network technologies, and increased adoption of cloud platform. Furthermore, development of smart transportation and smart cities has led to increased adoption of IoT. This in turns propels the growth of the SoC market.

High initial Cost of Design & Development and Maintenance

If the total number of SoCs to be developed is small, then the cost associated with each SoC will be very high. In addition, the cost incurred due to malfunction or failure of a single transistor or system damage is high as the complete board needs to be replaced. Moreover, servicing of SoC is expensive, which may impede the stated market growth.

High Demand for Compact and Scalable ICs in the Global Electronic Industry

Characteristics of compact and scalable ICs, such as compact size, lightweight, reduced cost, low power consumption, high reliability, and ease of replacement, play an important role in the electronic industry. Thus, there is continuous demand of applications loaded with ICs, which is expected to create lucrative opportunities for the key players operating in the global system-on-chip (SoC) market. In addition, ICs are implemented in various applications such as automobile, computers, television, and portable devices such as laptop, cell phones, camera, play stations, and more.

Key Benefits for Stakeholders

  • This study comprises analytical depiction of the global system-on-chip market with current trends and future estimations to depict the imminent investment pockets.
  • The overall market potential is determined to understand the profitable trends to gain a stronger foothold.
  • The report presents information related to key drivers, restraints, and opportunities with a detailed impact analysis.
  • The current market is quantitatively analyzed from 2017 to 2023 to highlight the financial competency of the market.
  • Porters Five Forces analysis illustrates the potency of the buyers and suppliers in the industry.

System-on-Chip Market Key Segments:

By Type

  • Digital
  • Analog
  • Mixed Signal

By Application

  • Consumer electronics
  • Telecommunication
  • Automotive

By Region

  • North America
    • U.S.
    • Canada
    • Mexico
  • Europe
    • UK
    • Germany
    • France
    • Rest of Europe
  • Asia-Pacific
    • China
    • Japan
    • India
    • Australia
    • Rest of Asia-Pacific
  • LAMEA
    • Latin America
    • Middle East
    • Africa

Key Market Players Profiled

  • Intel Corporation
  • Samsung Electronics Co. Ltd.
  • Qualcomm Incorporated
  • Toshiba Corporation
  • NXP Semiconductors N.V.
  • Broadcom Limited
  • STMicroelectronics N.V.
  • Apple Inc.
  • MediaTek Inc.
  • Taiwan Semiconductor Manufacturing Company Limited
  • Magna International Inc.
 

Chapter: 1: INTRODUCTION

1.1. REPORT DESCRIPTION
1.2. KEY BENEFITS FOR STAKEHOLDERS
1.3. KEY MARKET SEGMENTS
1.4. RESEARCH METHODOLOGY

1.4.1. Primary research
1.4.2. Secondary research
1.4.3. Analyst tools and models

Chapter: 2: EXECUTIVE SUMMARY

2.1. CXO PERSPECTIVE

Chapter: 3: MARKET OVERVIEW

3.1. MARKET DEFINITION AND SCOPE
3.2. KEY FINDINGS

3.2.1. Top impacting factors
3.2.2. Top investment pockets
3.2.3. Top winning strategies

3.3. PORTERS FIVE FORCES ANALYSIS

3.3.1. Moderate bargaining power of suppliers
3.3.2. Moderate threat of new entrants
3.3.3. Moderate threat of substitutes
3.3.4. High-to-moderate intensity of rivalry
3.3.5. Moderate bargaining power of buyers

3.4. KEY PLAYER POSITIONING (2016)
3.5. MARKET DYNAMICS

3.5.1. Drivers

3.5.1.1. Compact nature
3.5.1.2. Surge in demand for smart and power-efficient electronic devices
3.5.1.3. Rising adoption of IoT

3.5.2. Restraint

3.5.2.1. High initial cost of design & development and maintenance

3.5.3. Opportunity

3.5.3.1. Rising demand of compact and scalable ICs in global electronic industry

Chapter: 4: SYSTEM ON CHIP MARKET, BY TYPE

4.1. OVERVIEW
4.2. DIGITAL

4.2.1. Key market trends
4.2.2. Key growth factors and opportunities
4.2.3. Market size and forecast, by region
4.2.4. Market analysis by country

4.3. ANALOG

4.3.1. Key market trends
4.3.2. Key growth factors and opportunities
4.3.3. Market size and forecast, by region
4.3.4. Market analysis by country

4.4. MIXED SIGNAL

4.4.1. Key market trends
4.4.2. Key growth factors and opportunities
4.4.3. Market size and forecast, by region
4.4.4. Market analysis by country

Chapter: 5: SYSTEM ON CHIP MARKET, BY APPLICATION

5.1. OVERVIEW
5.2. CONSUMER ELECTRONICS

5.2.1. Key market trends
5.2.2. Market size and forecast, by region
5.2.3. Market analysis by country

5.3. TELECOMMUNICATION

5.3.1. Key market trends
5.3.2. Market size and forecast, by region
5.3.3. Market analysis by country

5.4. AUTOMOTIVE

5.4.1. Key market trends
5.4.2. Market size and forecast, by region
5.4.3. Market analysis by country

Chapter: 6: SYSTEM ON CHIP MARKET, BY REGION

6.1. OVERVIEW
6.2. NORTH AMERICA

6.2.1. Key market trends
6.2.2. Key growth factors and opportunities
6.2.3. Market size and forecast, by type
6.2.4. Market size and forecast, by application
6.2.5. Market analysis by country
6.2.6. U.S.

6.2.6.1. Market size and forecast, by type
6.2.6.2. Market size and forecast, by application

6.2.7. Canada

6.2.7.1. Market size and forecast, by type
6.2.7.2. Market size and forecast, by application

6.2.8. Mexico

6.2.8.1. Market size and forecast, by type
6.2.8.2. Market size and forecast, by application

6.3. EUROPE

6.3.1. Key market trends
6.3.2. Key growth factors and opportunities
6.3.3. Market size and forecast, by type
6.3.4. Market size and forecast, by application
6.3.5. Market analysis by country
6.3.6. UK

6.3.6.1. Market size and forecast, by type
6.3.6.2. Market size and forecast, by application

6.3.7. Germany

6.3.7.1. Market size and forecast, by type
6.3.7.2. Market size and forecast, by application

6.3.8. France

6.3.8.1. Market size and forecast, by type
6.3.8.2. Market size and forecast, by application

6.3.9. Rest of Europe

6.3.9.1. Market size and forecast, by type
6.3.9.2. Market size and forecast, by application

6.4. ASIA-PACIFIC

6.4.1. Key market trends
6.4.2. Key growth factors and opportunities
6.4.3. Market size and forecast, by type
6.4.4. Market size and forecast, by application
6.4.5. Market analysis by country
6.4.6. China

6.4.6.1. Market size and forecast, by type
6.4.6.2. Market size and forecast, by application

6.4.7. Japan

6.4.7.1. Market size and forecast, by type
6.4.7.2. Market size and forecast, by application

6.4.8. India

6.4.8.1. Market size and forecast, by type
6.4.8.2. Market size and forecast, by application

6.4.9. Australia

6.4.9.1. Market size and forecast, by type
6.4.9.2. Market size and forecast, by application

6.4.10. Rest of Asia-Pacific

6.4.10.1. Market size and forecast, by type
6.4.10.2. Market size and forecast, by application

6.5. LAMEA

6.5.1. Key market trends
6.5.2. Key growth factors and opportunities
6.5.3. Market size and forecast, by type
6.5.4. Market size and forecast, by application
6.5.5. Market analysis by country
6.5.6. Latin America

6.5.6.1. Market size and forecast, by type
6.5.6.2. Market size and forecast, by application

6.5.7. Middle East

6.5.7.1. Market size and forecast, by type
6.5.7.2. Market size and forecast, by application

6.5.8. Africa

6.5.8.1. Market size and forecast, by type
6.5.8.2. Market size and forecast, by application

Chapter: 7: COMPANY PROFILES

7.1. APPLE INC.

7.1.1. Company overview
7.1.2. Company snapshot
7.1.3. Operating business segments
7.1.4. Product portfolio
7.1.5. Business performance
7.1.6. Key strategic moves and developments

7.2. BROADCOM LIMITED

7.2.1. Company overview
7.2.2. Company snapshot
7.2.3. Operating business segments
7.2.4. Product portfolio
7.2.5. Business performance
7.2.6. Key strategic moves and developments

7.3. NXP SEMICONDUCTORS N.V. (FREESCALE SEMICONDUCTOR, LTD.)

7.3.1. Company overview
7.3.2. Company snapshot
7.3.3. Operating business segments
7.3.4. Product portfolio
7.3.5. Business performance
7.3.6. Key strategic moves and developments

7.4. INTEL CORPORATION

7.4.1. Company overview
7.4.2. Company snapshot
7.4.3. Operating business segments
7.4.4. Product portfolio
7.4.5. Business performance
7.4.6. Key strategic moves and developments

7.5. MEDIATEK INC.

7.5.1. Company overview
7.5.2. Company snapshot
7.5.3. Product portfolio
7.5.4. Business performance
7.5.5. Key strategic moves and developments

7.6. QUALCOMM INCORPORATED

7.6.1. Company overview
7.6.2. Company snapshot
7.6.3. Operating business segments
7.6.4. Product portfolio
7.6.5. Business performance
7.6.6. Key strategic moves and developments

7.7. SAMSUNG ELECTRONICS CO. LTD.

7.7.1. Company overview
7.7.2. Company snapshot
7.7.3. Operating business segments
7.7.4. Product portfolio
7.7.5. Business performance
7.7.6. Key strategic moves and developments

7.8. STMICROELECTRONICS N.V.

7.8.1. Company overview
7.8.2. Company snapshot
7.8.3. Operating business segments
7.8.4. Product portfolio
7.8.5. Business performance
7.8.6. Key strategic moves and developments

7.9. TAIWAN SEMICONDUCTOR MANUFACTURING COMPANY LIMITED

7.9.1. Company overview
7.9.2. Company snapshot
7.9.3. Operating business segments
7.9.4. Product portfolio
7.9.5. Business performance

7.10. TOSHIBA CORPORATION

7.10.1. Company overview
7.10.2. Company snapshot
7.10.3. Operating business segments
7.10.4. Product portfolio
7.10.5. Business performance

LIST OF TABLES

TABLE 01. SYSTEM ON CHIP MARKET REVENUE FOR DIGITAL TYPE, BY REGION 2016-2023 ($MILLION)
TABLE 02. SYSTEM ON CHIP MARKET REVENUE FOR ANALOG TYPE, BY REGION 2016-2023 ($MILLION)
TABLE 03. SYSTEM ON CHIP MARKET REVENUE FOR MIXED SIGNAL TYPE, BY REGION 2016-2023 ($MILLION)
TABLE 04. SYSTEM ON CHIP MARKET REVENUE FOR CONSUMER ELECTRONICS APPLICATION, BY REGION 2016-2023 ($MILLION)
TABLE 05. SYSTEM ON CHIP MARKET REVENUE FOR TELECOMMUNICATION APPLICATION, BY REGION 2016-2023 ($MILLION)
TABLE 06. SYSTEM ON CHIP MARKET REVENUE FOR AUTOMOTIVE APPLICATION, BY REGION 2016-2023 ($MILLION)
TABLE 07. NORTH AMERICAN SYSTEM ON CHIP MARKET, BY TYPE 2016-2023 ($BILLION)
TABLE 08. NORTH AMERICAN SYSTEM ON CHIP MARKET, BY APPLICATION 2016-2023 ($BILLION)
TABLE 09. U.S. SYSTEM ON CHIP MARKET, BY TYPE 2016-2023 ($BILLION)
TABLE 10. U.S. SYSTEM ON CHIP MARKET, BY APPLICATION 2016-2023 ($BILLION)
TABLE 11. CANADA SYSTEM ON CHIP MARKET, BY TYPE 2016-2023 ($BILLION)
TABLE 12. CANADA SYSTEM ON CHIP MARKET, BY APPLICATION 2016-2023 ($BILLION)
TABLE 13. MEXICO SYSTEM ON CHIP MARKET, BY TYPE 2016-2023 ($BILLION)
TABLE 14. MEXICO SYSTEM ON CHIP MARKET, BY APPLICATION 2016-2023 ($BILLION)
TABLE 15. EUROPEAN SYSTEM ON CHIP MARKET, BY TYPE 2016-2023 ($BILLION)
TABLE 16. EUROPEAN SYSTEM ON CHIP MARKET, BY APPLICATION 2016-2023 ($BILLION)
TABLE 17. UK SYSTEM ON CHIP MARKET, BY TYPE 2016-2023 ($BILLION)
TABLE 18. UK SYSTEM ON CHIP MARKET, BY APPLICATION 2016-2023 ($BILLION)
TABLE 19. GERMANY SYSTEM ON CHIP MARKET, BY TYPE 2016-2023 ($BILLION)
TABLE 20. GERMANY SYSTEM ON CHIP MARKET, BY APPLICATION 2016-2023 ($BILLION)
TABLE 21. FRANCE SYSTEM ON CHIP MARKET, BY TYPE 2016-2023 ($BILLION)
TABLE 22. FRANCE SYSTEM ON CHIP MARKET, BY APPLICATION 2016-2023 ($BILLION)
TABLE 23. REST OF EUROPE SYSTEM ON CHIP MARKET, BY TYPE 2016-2023 ($BILLION)
TABLE 24. REST OF EUROPE SYSTEM ON CHIP MARKET, BY APPLICATION 2016-2023 ($BILLION)
TABLE 25. ASIA-PACIFIC SYSTEM ON CHIP MARKET, BY TYPE 2016-2023 ($BILLION)
TABLE 26. ASIA-PACIFIC SYSTEM ON CHIP MARKET, BY APPLICATION 2016-2023 ($BILLION)
TABLE 27. CHINA SYSTEM ON CHIP MARKET, BY TYPE 2016-2023 ($BILLION)
TABLE 28. CHINA SYSTEM ON CHIP MARKET, BY APPLICATION 2016-2023 ($BILLION)
TABLE 29. JAPAN SYSTEM ON CHIP MARKET, BY TYPE 2016-2023 ($BILLION)
TABLE 30. JAPAN SYSTEM ON CHIP MARKET, BY APPLICATION 2016-2023 ($BILLION)
TABLE 31. INDIA SYSTEM ON CHIP MARKET, BY TYPE 2016-2023 ($BILLION)
TABLE 32. INDIA SYSTEM ON CHIP MARKET, BY APPLICATION 2016-2023 ($BILLION)
TABLE 33. AUSTRALIA SYSTEM ON CHIP MARKET, BY TYPE 2016-2023 ($BILLION)
TABLE 34. AUSTRALIA SYSTEM ON CHIP MARKET, BY APPLICATION 2016-2023 ($BILLION)
TABLE 35. REST OF ASIA-PACIFIC SYSTEM ON CHIP MARKET, BY TYPE 2016-2023 ($BILLION)
TABLE 36. REST OF ASIA-PACIFIC SYSTEM ON CHIP MARKET, BY APPLICATION 2016-2023 ($BILLION)
TABLE 37. LAMEA SYSTEM ON CHIP MARKET, BY TYPE 2016-2023 ($BILLION)
TABLE 38. LAMEA SYSTEM ON CHIP MARKET, BY APPLICATION 2016-2023 ($BILLION)
TABLE 39. LATIN AMERICA SYSTEM ON CHIP MARKET, BY TYPE 2016-2023 ($BILLION)
TABLE 40. LATIN AMERICA SYSTEM ON CHIP MARKET, BY APPLICATION 2016-2023 ($BILLION)
TABLE 41. MIDDLE EAST SYSTEM ON CHIP MARKET, BY TYPE 2016-2023 ($BILLION)
TABLE 42. MIDDLE EAST SYSTEM ON CHIP MARKET, BY APPLICATION 2016-2023 ($BILLION)
TABLE 43. AFRICA SYSTEM ON CHIP MARKET, BY TYPE 2016-2023 ($BILLION)
TABLE 44. AFRICA SYSTEM ON CHIP MARKET, BY APPLICATION 2016-2023 ($BILLION)
TABLE 45. APPLE: COMPANY SNAPSHOT
TABLE 46. APPLE: OPERATING SEGMENTS
TABLE 47. APPLE: PRODUCT PORTFOLIO
TABLE 48. BROADCOM: COMPANY SNAPSHOT
TABLE 49. BROADCOM: OPERATING SEGMENTS
TABLE 50. BROADCOM: PRODUCT PORTFOLIO
TABLE 51. NXP: COMPANY SNAPSHOT
TABLE 52. NXP: OPERATING SEGMENTS
TABLE 53. NXP: PRODUCT PORTFOLIO
TABLE 54. INTEL: COMPANY SNAPSHOT
TABLE 55. INTEL: OPERATING SEGMENTS
TABLE 56. INTEL: PRODUCT PORTFOLIO
TABLE 57. MEDIATEK: COMPANY SNAPSHOT
TABLE 58. MEDIATEK: PRODUCT PORTFOLIO
TABLE 59. QUALCOMM: COMPANY SNAPSHOT
TABLE 60. QUALCOMM: OPERATING SEGMENTS
TABLE 61. QUALCOMM: PRODUCT PORTFOLIO
TABLE 62. SAMSUNG: COMPANY SNAPSHOT
TABLE 63. SAMSUNG: OPERATING SEGMENTS
TABLE 64. SAMSUNG: PRODUCT PORTFOLIO
TABLE 65. STMICROELECTRONICS: COMPANY SNAPSHOT
TABLE 66. STMICROELECTRONICS: OPERATING SEGMENTS
TABLE 67. STMICROELECTRONICS: PRODUCT PORTFOLIO
TABLE 68. TSMC: COMPANY SNAPSHOT
TABLE 69. TSMC: OPERATING SEGMENTS
TABLE 70. TSMC: PRODUCT PORTFOLIO
TABLE 71. TOSHIBA: COMPANY SNAPSHOT
TABLE 72. TOSHIBA: OPERATING SEGMENTS
TABLE 73. TOSHIBA: PRODUCT PORTFOLIO

LIST OF FIGURES

FIGURE 01. KEY MARKET SEGMENTS
FIGURE 02. EXECUTIVE SUMMARY
FIGURE 03. EXECUTIVE SUMMARY
FIGURE 04. TOP IMPACTING FACTORS
FIGURE 05. TOP INVESTMENT POCKETS
FIGURE 06. MARKET PLAYER POSITIONING
FIGURE 07. GLOBAL SYSTEM ON CHIP MARKET, BY TYPE, 2016-2023
FIGURE 08. COMPARATIVE SHARE ANALYSIS OF DIGITAL SYSTEM ON CHIP MARKET, BY COUNTRY, 2016 & 2023 (%)
FIGURE 09. COMPARATIVE SHARE ANALYSIS OF ANALOG SYSTEM ON CHIP MARKET, BY COUNTRY, 2016 & 2023 (%)
FIGURE 10. COMPARATIVE SHARE ANALYSIS OF MIXED SIGNAL SYSTEM ON CHIP MARKET, BY COUNTRY, 2016 & 2023 (%)
FIGURE 11. GLOBAL SYSTEM ON CHIP MARKET, BY APPLICATION, 2016-2023
FIGURE 12. COMPARATIVE SHARE ANALYSIS OF CONSUMER ELECTRONICS APPLICATION ON CHIP MARKET, BY COUNTRY, 2016 & 2023 (%)
FIGURE 13. COMPARATIVE SHARE ANALYSIS OF TELECOMMUNICATION SYSTEM ON CHIP MARKET, BY COUNTRY, 2016 & 2023 (%)
FIGURE 14. COMPARATIVE SHARE ANALYSIS OF AUTOMOTIVE SYSTEM ON CHIP MARKET, BY COUNTRY, 2016 & 2023 (%)
FIGURE 15. SYSTEM ON CHIP MARKET, BY REGION, 2016-2023 (%)
FIGURE 16. COMPARATIVE SHARE ANALYSIS OF SYSTEM ON CHIP MARKET, BY COUNTRY, 2016 & 2023 (%)
FIGURE 17. U.S. SYSTEM ON CHIP MARKET, 2016-2023($BILLION)
FIGURE 18. CANADA SYSTEM ON CHIP MARKET, 2016-2023($BILLION)
FIGURE 19. MEXICO SYSTEM ON CHIP MARKET, 2016-2023($BILLION)
FIGURE 20. COMPARATIVE SHARE ANALYSIS OF SYSTEM ON CHIP MARKET, BY COUNTRY, 2016 & 2023 (%)
FIGURE 21. UK SYSTEM ON CHIP MARKET, 2016-2023($BILLION)
FIGURE 22. GERMANY SYSTEM ON CHIP MARKET, 2016-2023($BILLION)
FIGURE 23. FRANCE SYSTEM ON CHIP MARKET, 2016-2023($BILLION)
FIGURE 24. REST OF EUROPE SYSTEM ON CHIP MARKET, 2016-2023($BILLION)
FIGURE 25. COMPARATIVE SHARE ANALYSIS OF SYSTEM ON CHIP MARKET, BY COUNTRY, 2016 & 2023 (%)
FIGURE 26. CHINA SYSTEM ON CHIP MARKET, 2016-2023($BILLION)
FIGURE 27. JAPAN SYSTEM ON CHIP MARKET, 2016-2023($BILLION)
FIGURE 28. INDIA SYSTEM ON CHIP MARKET, 2016-2023($BILLION)
FIGURE 29. AUSTRALIA SYSTEM ON CHIP MARKET, 2016-2023($BILLION)
FIGURE 30. REST OF ASIA-PACIFIC SYSTEM ON CHIP MARKET, 2016-2023($BILLION)
FIGURE 31. COMPARATIVE SHARE ANALYSIS OF SYSTEM ON CHIP MARKET, BY COUNTRY, 2016 & 2023 (%)
FIGURE 32. LATIN AMERICA SYSTEM ON CHIP MARKET, 2016-2023($BILLION)
FIGURE 33. MIDDLE EAST SYSTEM ON CHIP MARKET, 2016-2023($BILLION)
FIGURE 34. AFRICA SYSTEM ON CHIP MARKET, 2016-2023($BILLION)
FIGURE 35. APPLE: NET SALES, 2015-2017 ($MILLION)
FIGURE 36. APPLE: REVENUE SHARE BY SEGMENT, 2017 (%)
FIGURE 37. APPLE: REVENUE SHARE BY GEOGRAPHY, 2017 (%)
FIGURE 38. BROADCOM: NET SALES, 2015-2017 ($MILLION)
FIGURE 39. BROADCOM: REVENUE SHARE BY SEGMENT, 2017 (%)
FIGURE 40. BROADCOM: REVENUE SHARE BY GEOGRAPHY, 2017 (%)
FIGURE 41. NXP: NET SALES, 2014-2016 ($MILLION)
FIGURE 42. NXP: REVENUE SHARE BY SEGMENT, 2016 (%)
FIGURE 43. NXP: REVENUE SHARE BY GEOGRAPHY, 2016 (%)
FIGURE 44. INTEL: NET SALES, 2014-2016 ($MILLION)
FIGURE 45. INTEL: REVENUE SHARE BY SEGMENT, 2016 (%)
FIGURE 46. INTEL: REVENUE SHARE BY GEOGRAPHY, 2016 (%)
FIGURE 47. MEDIATEK: NET SALES, 2014-2016 ($MILLION)
FIGURE 48. MEDIATEK: REVENUE SHARE BY GEOGRAPHY, 2016 (%)
FIGURE 49. QUALCOMM: NET SALES, 2015-2017 ($MILLION)
FIGURE 50. QUALCOMM: REVENUE SHARE BY SEGMENT, 2017 (%)
FIGURE 51. SAMSUNG: NET SALES, 2014-2016 ($MILLION)
FIGURE 52. SAMSUNG: REVENUE SHARE BY SEGMENT, 2016 (%)
FIGURE 53. SAMSUNG: REVENUE SHARE BY GEOGRAPHY, 2016 (%)
FIGURE 54. STMICROELECTRONICS: NET SALES, 2014-2016 ($MILLION)
FIGURE 55. STMICROELECTRONICS: REVENUE SHARE BY SEGMENT, 2016 (%)
FIGURE 56. STMICROELECTRONICS: REVENUE SHARE BY GEOGRAPHY, 2016 (%)
FIGURE 57. TSMC: NET SALES, 2014-2016 ($MILLION)
FIGURE 58. TSMC: REVENUE SHARE BY GEOGRAPHY, 2016 (%)
FIGURE 59. TOSHIBA: NET SALES, 2015-2017 ($MILLION)
FIGURE 60. TOSHIBA: REVENUE SHARE BY SEGMENT, 2017 (%)
FIGURE 61. TOSHIBA: REVENUE SHARE BY GEOGRAPHY, 2017 (%)

回上頁